How to Track Video Views, Engagement, and Add to Cart Performance
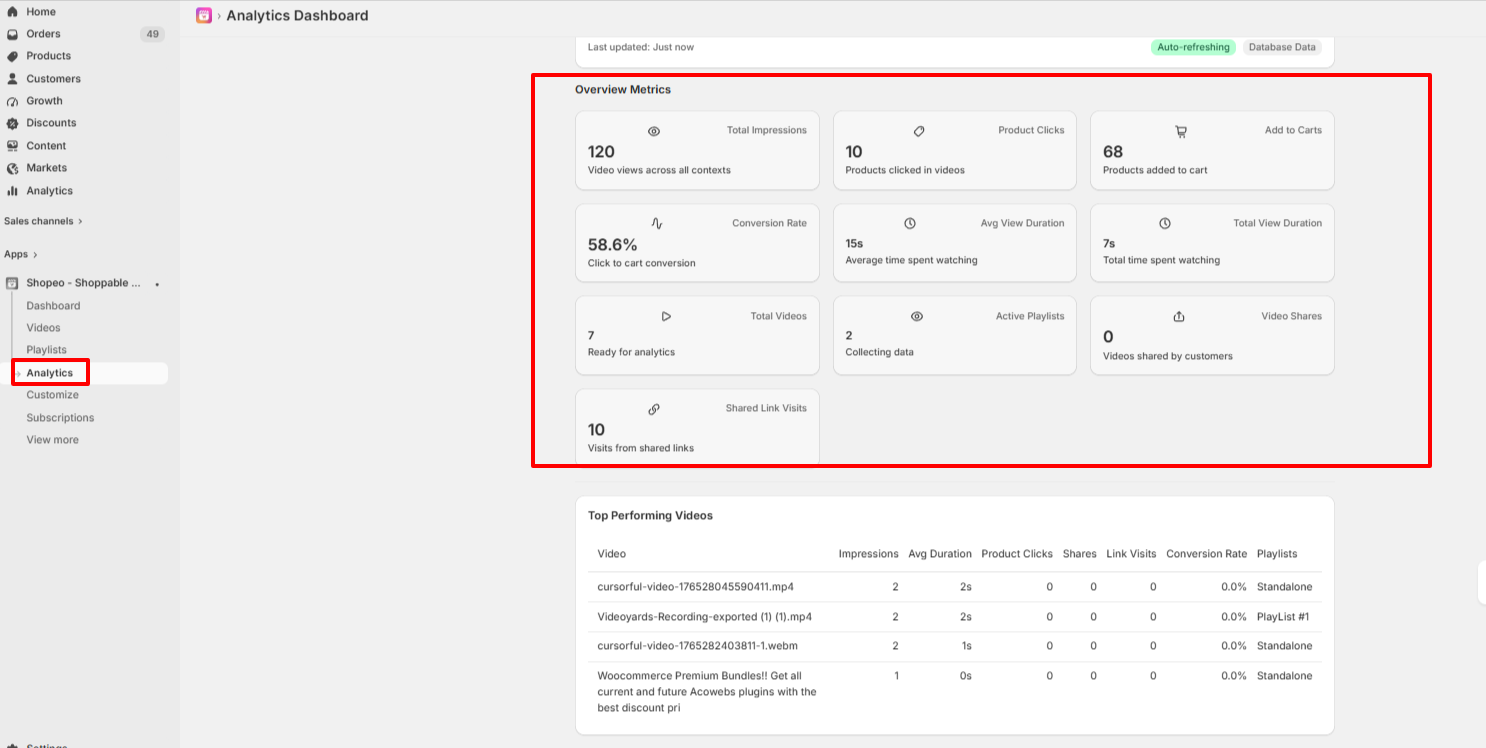
Shopeo features a built-in tracking dashboard that provides real-time, concrete insights into how your storefront traffic interacts with your media elements. To access your data reports, simply click on the Analytics tab in the left-hand side app menu of your dashboard.
Understanding Your Overview Metrics
The main interface features a dedicated Overview Metrics panel grid layer that gives you an immediate bird’s-eye view of your video commerce health:
Total Impressions: Reflects the aggregate count of how many times your videos have been viewed across your various active store layouts and page contexts.
Product Clicks: Tracks user interactive intent by registering the total number of times clients clicked on specific product tags pinned inside your live streams.
Add to Carts: Measures structural shopping conversion success by calculating the precise number of products added straight to checkout directly from your video container layouts.
Conversion Rate: Calculates your interactive audience purchase intent by displaying the exact percentage of viewers who clicked a tagged product and committed to an Add to Cart action.
Avg View Duration: Highlights the baseline attention span of your users by recording the average continuous time customer profiles spent watching your media assets.
Total View Duration: Aggregates total overall playback minutes to show cumulative consumer attention trends across all store visits.
Total Videos: Displays the current count of active video uploads or imports currently mapped in your core system and verified for metric analysis tracking.
Active Playlists: Reflects the sum of your live playlist feeds currently collecting behaviour data strings across your storefront sections.
Video Shares: Counts the precise instances where users engaged with your content by clicking the player’s share configuration functions.
Shared Link Visits: Evaluates word-of-mouth growth by tracking exactly how many incoming web store click-through visits were generated via customer-shared video web URLs.
Deep-Dive Analysis: Top Performing Videos Table
Directly beneath the top matrix dashboard layout, Shopeo populates a detailed log row system for your individual assets under the Top Performing Videos list section.
This tracking sheet isolates itemized performance data—such as impressions, specific click-through ratios, conversion rates, and linked playlists—for every individual media file. By monitoring this breakdown data periodically, you can determine exactly which content creators, video styles, or specific items generate the highest return on investment (ROI) for your brand strategy.


















 Login
Login
 Cart
Cart