To track how your shoppable videos impact your bottom line, Shopeo features a dedicated, database-driven Analytics Dashboard. This real-time reporting tool lets you measure buyer intent, monitor reach, and optimize your overall video commerce strategy
View Your Performance Reports
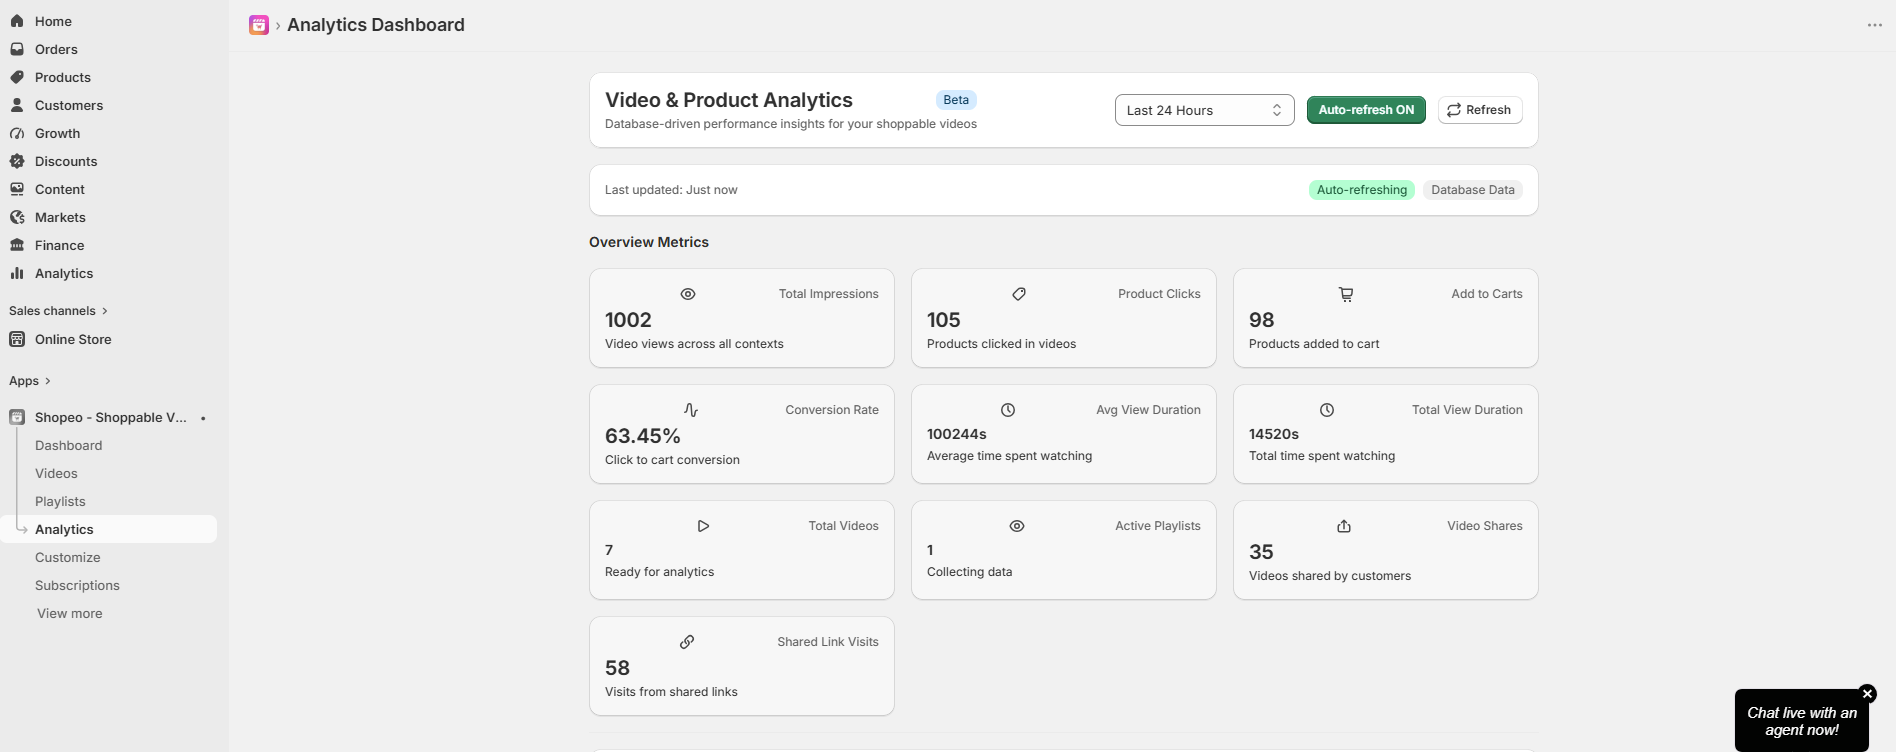
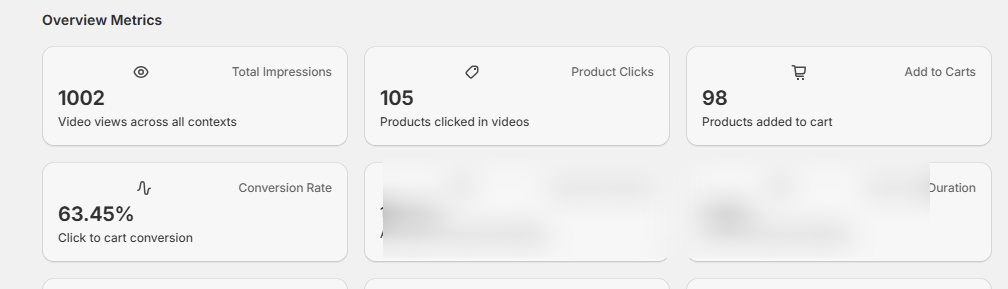
To get started, open the Analytics section from your main app dashboard. The layout is broken down into high-level Overview Metrics so you can check your store’s performance at a glance:
Total Impressions: Tracks your total aggregate video views across all active storefront pages.
Product Clicks: Counts how many times users interact with your tagged product details.
Add to Carts: Measures direct purchase intent by tracking how many items are added to shopping carts directly from the video player.
Conversion Rate: Calculates your exact click-to-cart conversion percentage so you can see how effectively your media turns viewers into buyers.
Monitor Viewer Behavior
Understanding how long users watch your content helps you refine your video editing and hook strategies:
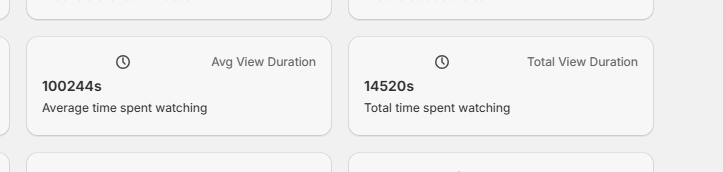
Avg View Duration: Displays the average time a customer spends watching an individual video clip.
Total View Duration: Tracks the cumulative time spent across all views on your platform.
Total Videos & Active Playlists: Keeps a live count of your data-collecting assets and publishing loops.
Track Organic Reach & Shares
Shopeo also measures your word-of-mouth success beyond your main storefront pages:
Video Shares: Keeps track of how many times customers use the native share button inside the player canvas.
Shared Link Visits: Logs the total traffic coming back to your store through those organically shared links.
Tip: Use this data to run quick tests! If a playlist has high Impressions but low Product Clicks, try re-arranging your tagged inventory or altering your thumbnails using the Styles Customization suite to make your shopping call-to-actions stand out more
Deep-Dive into Granular Analytics Panels
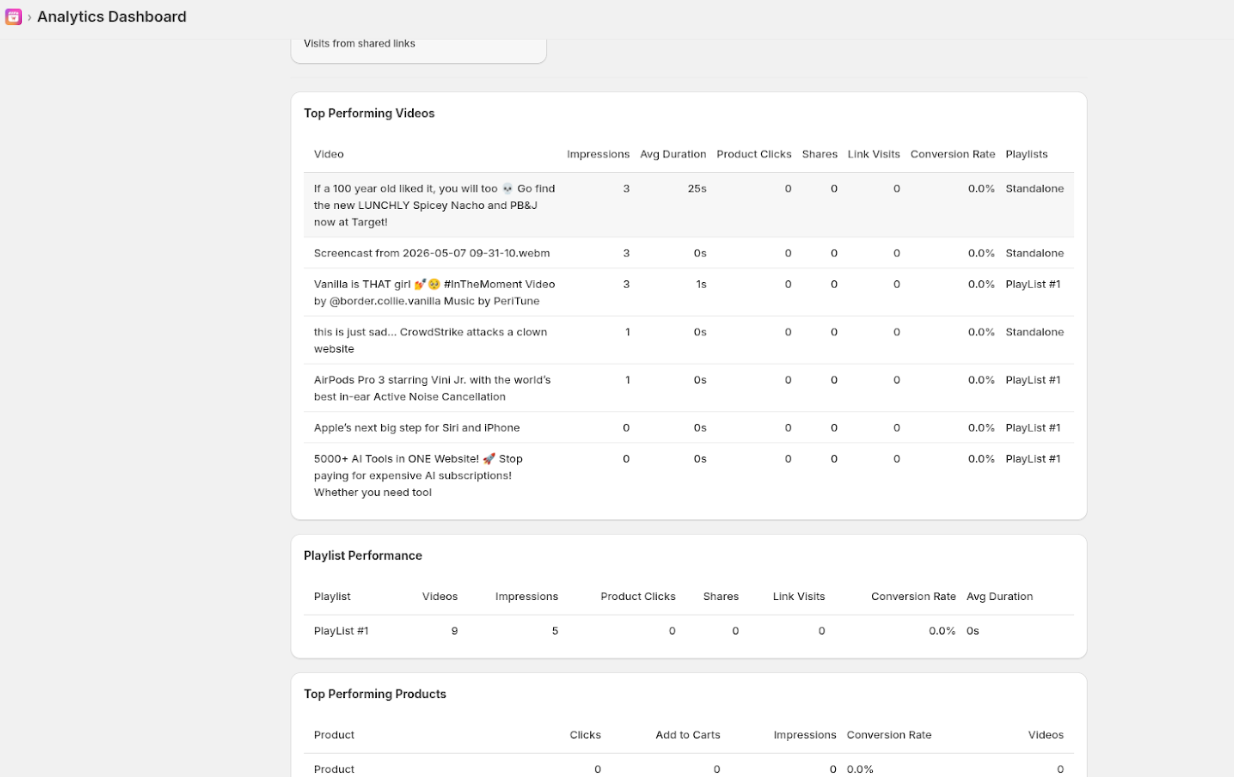
As you scroll further down the dashboard, to unlocks itemized breakdown tables to help you identify exactly which individual assets are driving results.
A. Top Performing Videos Panel
This table breaks down analytics on an individual, video-by-video level. For each clip, you can review specific columns:
Video Titles & Context: Identifies your specific uploaded files, imported social captions, and whether they belong to a standalone unit or a structured collection.
Individual Metrics: Compares Impressions, Avg Duration (e.g., viewing trends like 25s vs 0s), Product Clicks, Shares, Link Visits, and the precise Conversion Rate unique to that file.
B. Playlist Performance Panel
If you manage multiple video groups, this panel evaluates the collective success of your grouped loops (e.g., PlayList #1). It reports:
Videos Count: The total number of active media clips bundled inside that specific playlist block.
Group Engagement Data: Consolidated tallies for overall Impressions, total Product Clicks, combined Shares, and the playlist’s net Conversion Rate and Avg Duration.
C. Top Performing Products Panel
This section correlates video content directly with your physical Shopify store inventory items. Use this table to track which merchandise captures the most attention by monitoring:
Product Clicks & Add to Carts: Total direct interaction volume driven to specific items via video overlay detail cards.
Impressions & Conversion Rate: How often items appear inside active players compared to how often they generate a purchase action.
Videos Matrix: The total number of individual clips that currently have that specific item tagged.
Accessing Individual Video Analytics from the Product Level
In addition to using the main dashboard, you can also view specific metrics for any single video asset directly from your video library. This makes it easy to track a single video’s performance without digging through a full report.
Spot Quick Metrics in the Video Library
When you open the Videos tab in the Shopeo app dashboard, you will see a list of your uploaded clips
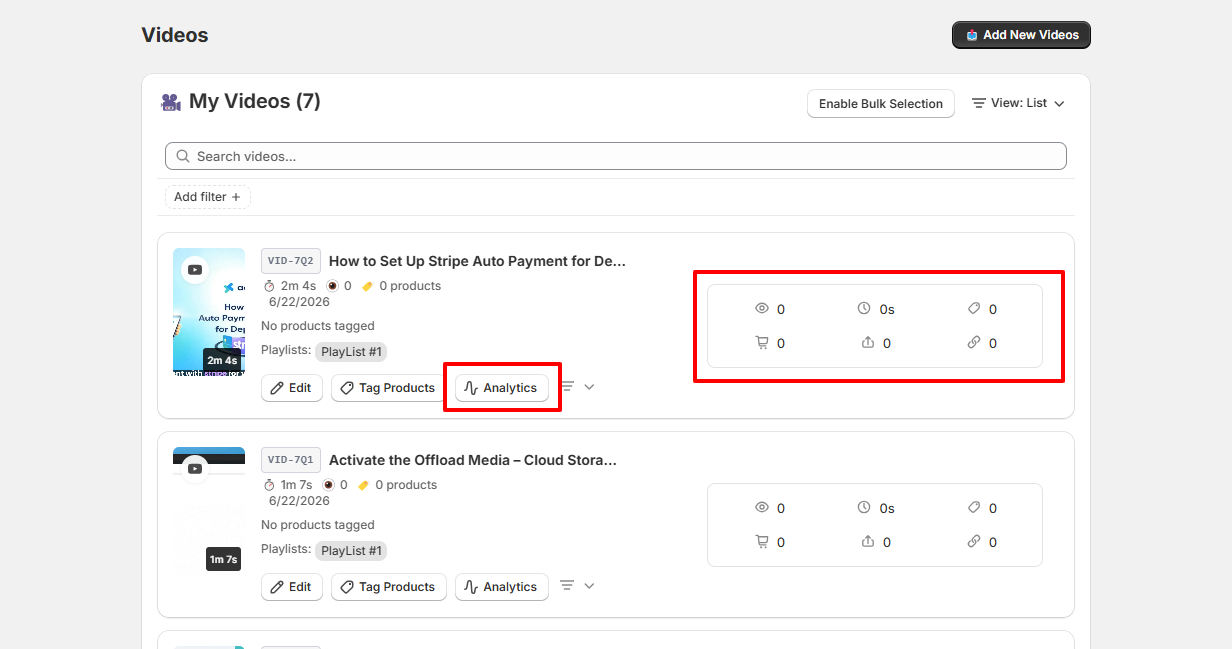
Each video card features a quick-glance performance preview layout on the right side. This section lets you check key live counters instantly:
Top Row: View total impressions (eye icon), total view duration (clock icon), and total product clicks (tag icon).
Bottom Row: Keep tabs on total items added to carts (shopping cart icon), video shares (upload icon), and shared link visits (link icon).
Launch the Detailed Video Performance Modal
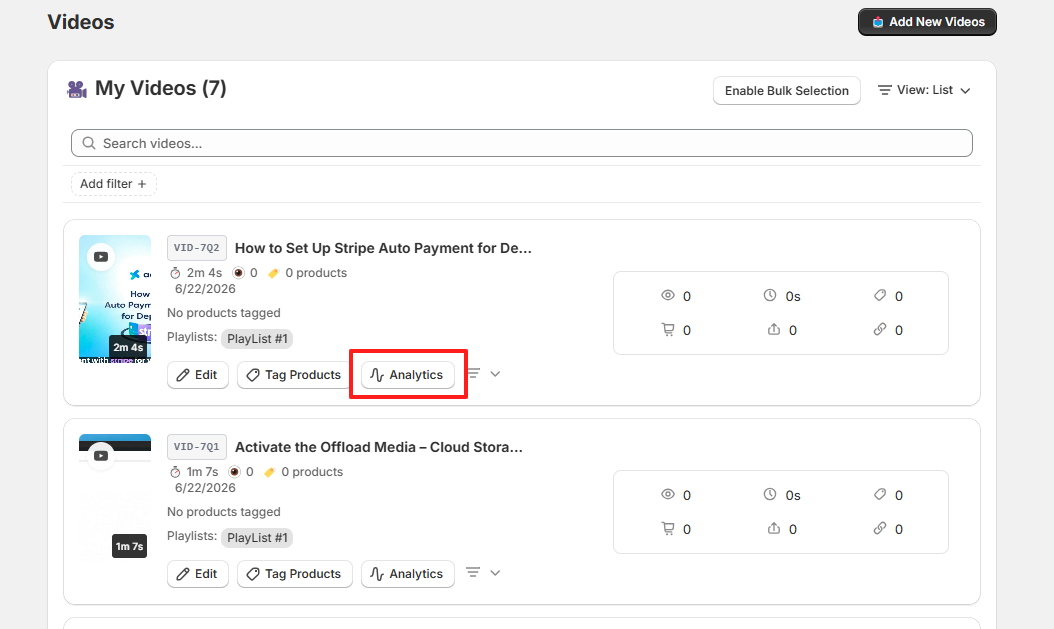
Click the Analytics button located next to Tag Products .
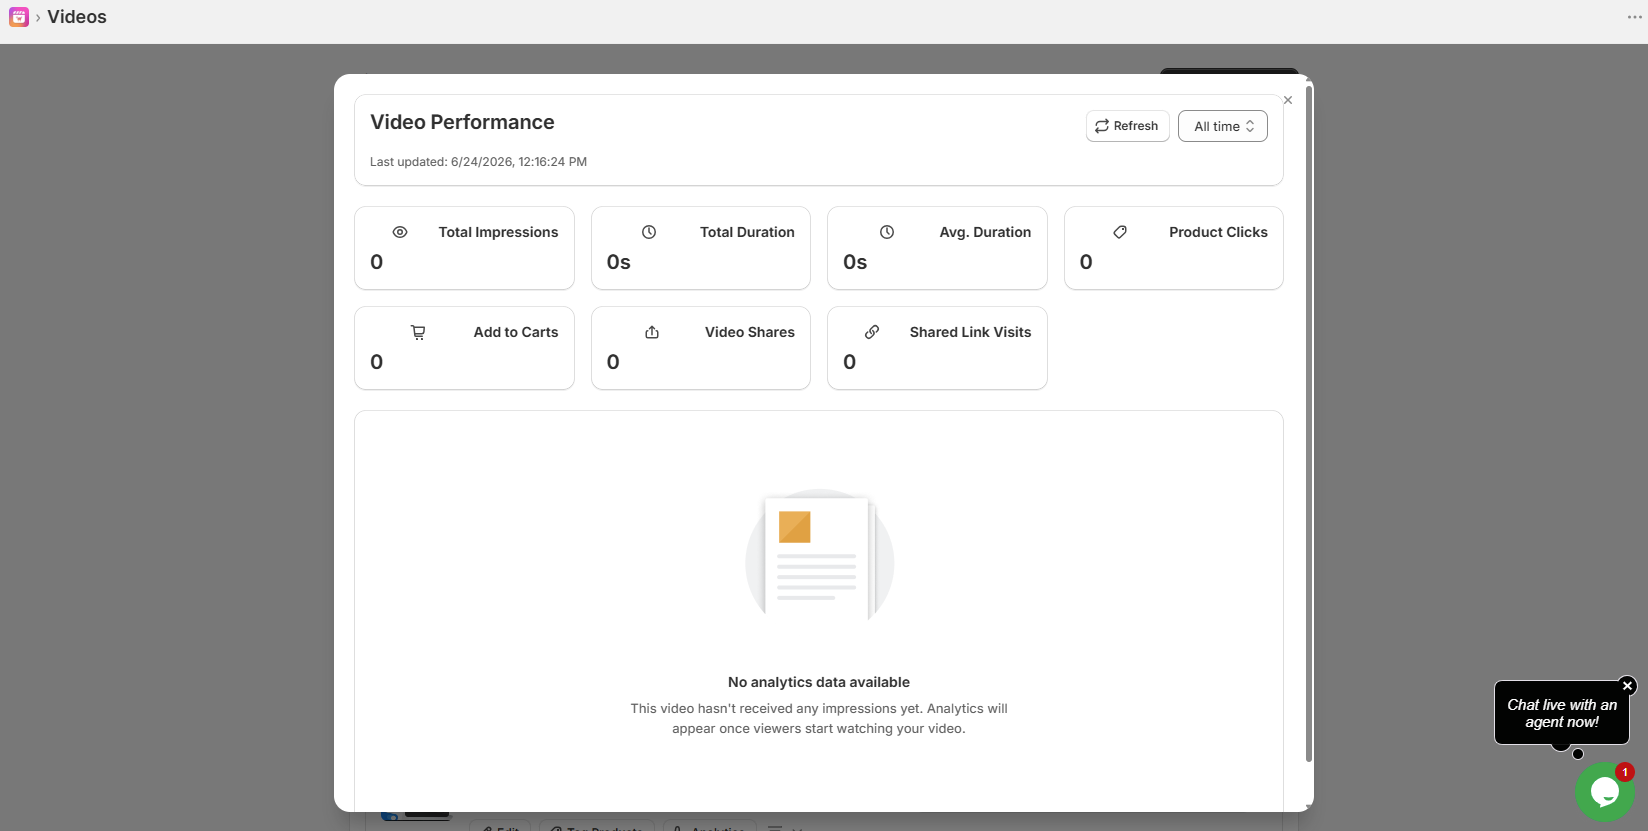
This opens the Video Performance pop-up modal.
Here, you can review dedicated data containers tracking metrics like Total Impressions, Total Duration, Avg. Duration, Product Clicks, Add to Carts, Video Shares, and Shared Link Visits.
You can also filter the performance timeline using the dropdown box (e.g., set to All time), or click Refresh to pull in the latest real-time user interactions.
Note: If you just launched a new clip, the bottom panel will display a “No analytics data available” placeholder until customers begin watching the video on your storefront.















 Login
Login
 Cart
Cart