


 Login
Login
 Cart
Cart
The thing that makes metrics stand out is their role in enabling digital marketers to observe and measure performance for decision-making purposes.
If you are running an ad, metrics will tell you how many people are responding to your marketing strategy. However, it is easy to get lost in eCommerce metrics given the overwhelming number of metrics businesses are required to measure.
But not all metrics will bring value to your business, and understanding which key performance indicators (KPIs) will help improve your digital store sales will go a long way in improving the conversion rates over time.
Operating an eCommerce store without metrics is equivalent to driving with your eyes closed. Your business cannot last long without tracking its progress, making metrics a key element of business performance.
You need to gather the right information and get actionable insights to use to enhance your digital marketing efforts.
We also understand it can be challenging settling on what online business metrics to monitor given the limitless amount of data from your store, social media, email, and other sources.
That’s why we have compiled this article for you, in which you will learn about metrics, KPIs, and important eCommerce metrics you should measure.
What is a Metric?
A metric is any defined measurement, which can be quantified and observed consistently. eCommerce metrics vary from abandonment rates to conversion rates and average order value.
Some of the main sources of data to use when measuring the performance of your eCommerce store include Google analytics, product pages, social media, and checkout pages. These resources are ripe with quantifiable data for your analysis and interpretation.
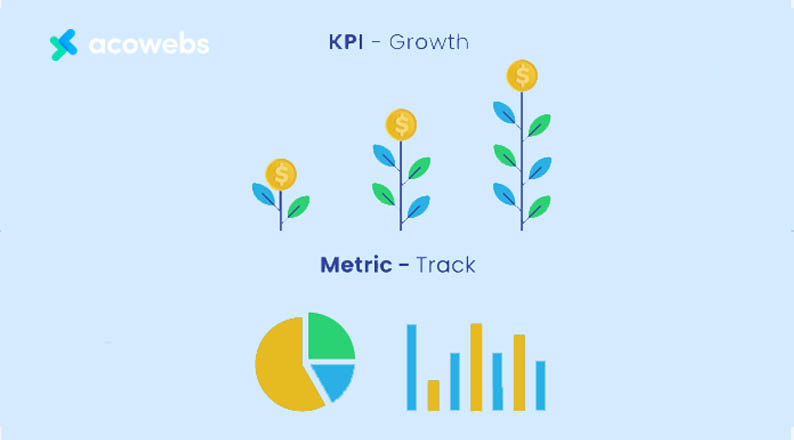
How Does a Metric Differ From an eCommerce KPI?
Let’s say you are monitoring several performance indicators relative to your goals, such as the number of unique site visitors per day. To avoid monitoring performance using multiple indicators, many marketers often choose to focus on two or three essential data points or KPIs.
While metrics measure processes, KPIs gauge the performance of the business processes in a more accurate and succinct manner. KPIs are specific targets you are aiming to achieve for your business.
For instance, the average order value (AOV) is a metric, while an AOV target of $50 can be your KPI.
eCommerce metrics and KPIs are used together to shape the growth of online retail sales. Remember to keep your metrics relevant to your business goals.
Therefore, if you are using email marketing then you should use related metrics like open rate, bounce rate, and click-through-rate (CTR) to measure performance.
Now that you understand what metrics are, let’s dive into the most essential metrics to measure.
8 Important eCommerce Metrics You Should Measure
Data collection and analysis can be tedious if you don’t have an efficient and effective methodology for implementation.
We also understand that you cannot track everything. That’s why you should focus on the most essential metrics to inform your decision-making on performance issues, such as average customer preferences, marketing strategies, and revenue maximization.
Here are the leading metrics you must track to boost your eCommerce business growth:
1. Sales Conversion Rate
The sales conversion rate is one of the most important eCommerce metrics for digital marketers. It is a measure of the percentage of site visitors that actually make a purchase.
According to the latest studies in 2020 by Invesp, the average conversion rate for eCommerce sites stands at 2.86%. In the US, the average website conversion rate is 2.63%, while the global rate is 4.31%.
A conversion rate between 1% and 5% is fair enough for your digital outlet.
To determine your store’s conversion rate use the following formula:
“Total number of conversions / Total number of visitor sessions”
For instance, if the number of site sessions for your digital store is 50,000 and the total number of orders is 5,000, your conversion rate is 5,000/50,000 = 10%.
How can you use this information to improve your eCommerce store sales?
- Focus on top-performing traffic sources – use your analytics report to see the highest sources of your site traffic and focus on these channels in your marketing campaigns.
- Promote products with the best conversion rates.
- Perform A/B tests on your page design, different product offers, and traffic sources – use the results for targeted marketing.
- Invest in a mobile shopping app for a more personalized customer experience through location data, notifications, and outstanding design and performance.
ALSO READ: Tips to use content marketing for eCommerce sales
2. Customer Lifetime Value
Customer lifetime value (CLTV) indicates how much a given customer is worth to your business. This insight shows the overall value of your customers, giving you a better understanding of which customers are likely to become repeat clients.
Customers with a high CLTV are highly likely to be fans of your brand, meaning you can focus your customer retention strategies towards them.
Did you know that it costs businesses five times more to acquire a new customer than to retain an existing one?
That’s why it is important to monitor the performance of your business using either the historical or predictive CLTV.
Historical CLTV is the value of a customer based on their past purchases, while predictive CLTV is a prediction of the future life time value of a customer based on past purchase behavior.
You can use the following formula to determine your customer’s historical CLTV:
“Average order value x Average number of purchases made over the past one year”
Predictive CLTV is obtained as follows:
“Average order value x Purchase frequency / Average customer lifetime”
You can also calculate CLTV using this free online calculator.
For instance, let’s assume the average order value for electronics for a given customer is $200, the purchase frequency is twice annually, and the average customer lifespan is 2 years, then the CLTV for this shopper is $200.
You can compare an individual customer’s CLTV to the overall average CLTV to see your above-average buyers. The results will help you craft customized marketing strategies to cross-sell and upsell to target clients of interest, leading to improved sales.
3. Average Order Value
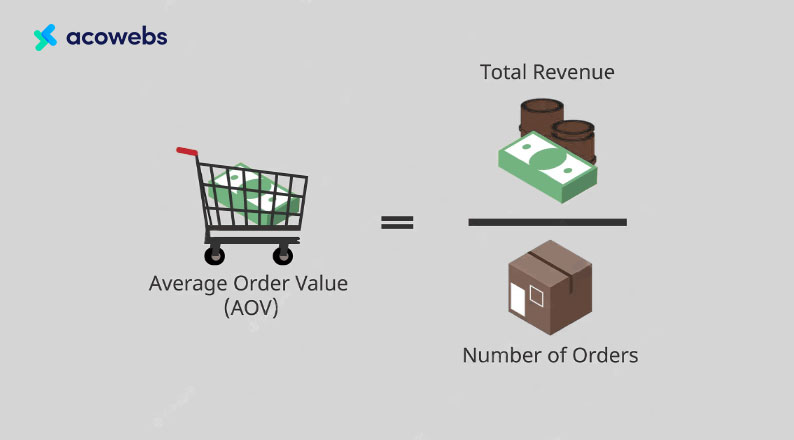
Being one of the most crucial eCommerce metrics, the average order value (AOV) shows you the average monetary value of each order or purchase made by customers visiting your store.
You can obtain the AOV by simply dividing the total value or revenue made from all sales made by the number of carts or orders made.
You can track AOV by segmenting your site visitors according to sources of traffic, type of device used, customer location, or by marketing channels.
You should then identify the different acquisition channels, generating the highest AOV to enable you to run relevant marketing campaigns and improve your ROI.
Google Analytics and plugins, such as WooCommerce Google Analytics, will help you track your online store’s AOV.
Some of the ways to increase your eCommerce AOV include:
- Upselling complementary items that help customers enhance the usability of the primary products bought, such as add-ons (maintenance services or a matching accessory).
- Selling bundled products, enabling customers to gain from discounts as opposed to buying items separately.
- Offering bonus schemes or loyalty programs.
- Offering free shipping on purchases within or above a given threshold to entice customers to buy more.
For instance, you may discover that certain types of products, such as those requiring regular maintenance or accessories, usually drive the order value up, giving you insights into which items to market to which group of customers.
By tracking your AOV, you can set certain benchmarks for certain products or groups of customers and use the results to determine ways to get people to spend more per every purchase made.
ALSO READ: How to use psychology to shape your E-commerce success
4. Cost per acquisition (CPA)/ Customer acquisition cost (CAC)
As an eCommerce owner, you should care about CPA/CAC because these metrics show the value of your marketing campaigns and the value of each customer to your business. They help you determine the profitability of your business.
Your cost of production, such as investment in advertisements and rebranding, will enable you to drive traffic and sales.
However, if the cost of these inputs outweighs the revenues you’re generating from sales, you are making poor investment decisions.
To gauge how well your business is performing using the CPA metric, you should compare it to the AOV. For instance, if your CPA is $50 and your AOV is $200, you are making good business decisions, but if the CPA is higher than AOV, you should reevaluate your marketing and operational strategies.
To determine your CPA or CAC, you can use the following formula:
“Total amount spent on customer acquisition / Total number of customers acquired”
You can improve your CPA by segmenting your marketing campaigns to better target more responsive customers. Your existing customers are easier and cheaper to sell to because they already know about your brand.
You can also approach ready clients within a specific niche using appropriate call-to-action buttons and landing pages, improving your conversions and revenues at manageable marketing costs.
Identifying and using cheaper channels for customer acquisition, such as email campaigns will help you optimize your operations to gain higher returns on investment (ROI).
5. Cart Abandonment Rate
Cart abandonment rate is a major issue affecting eCommerce outlets, with some industries recording as high as 88.05% in abandoned online shopping orders. On average, 70% of online shoppers abandon their carts.
The metric shows the percentage of customers who add items to their cart but leave without completing the purchase. The good news is that it is possible to reverse the negative trend, making it essential to measure and lower the cart abandonment rate as much as possible.
To determine your card abandonment rate, use the following formula:
“Number of purchases completed / Number of shopping carts created”
You can track your eCommerce store’s rate of cart abandonment using any cart abandonment tool.
Customers could be abandoning your shopping carts for a number of reasons, including website errors, high delivery costs, and complicated checkout processes, among others.
To keep shoppers from abandoning carts, you should start by understanding the touchpoints contributing to the problem then taking appropriate actions to close the gaps.
For instance, you can take the following measures:
- Simplify your store’s checkout process, enabling customers to order smoothly.
- Send cart abandonment emails to remind shoppers of their abandoned carts and convince them to complete their purchases.
- Use remarketing tactics by anonymously engaging past site visitors using a tailored message to entice them to return to your site to make a purchase.
6. Email conversion rate
Email marketing is one of the leading strategies digital marketers use to engage with customers and improve conversions.
There are many eCommerce metrics to measure when using email marketing, such as open rates, click-throughs, bounce rates, and subscription rates.
However, if you cannot link email engagement to revenue it will be difficult to optimize your marketing campaigns for improved conversions.
Indeed, a report by Campaign Monitor shows that when done right, email marketing can drive up to $44 in ROI for every dollar spent. You stand to gain even more revenue, by about 320%, from using automated emails to engage your customers.
The report also shows that email marketing will give you approximately 174% more conversions than social media.
To determine your email conversion relative to revenue, use the following formula:
“Number of sales from emails / Total number of delivered emails“
You can also use online tools, such as Popupsmart’s email ROI calculator, to determine the average value of each conversion for your eCommerce store.
The goal is to determine the total revenue of sales that you make directly from using email marketing campaigns. You can use this information to assess and review your marketing strategies to target more email users.
At the same time, you can measure your email opt-in rates of every channel on your website. Tools like Google Analytics will enable you to track your opt-ins to determine the number of people joining your email list from the homepage, thank you page, or checkout page.
7. Social Media Conversion Rate

Social media-related metrics are more than the general number of likes and retweets. Instead, you should focus on more meaningful eCommerce metrics, such as the number of subscriptions and average number of clicks per post.
Social media interactions help determine the level of engagement customers have with your brand while providing a line of communication in the form of feedback.
The number of clicks per post will tell you the total number of click-throughs from social media posts in a given period.
You can obtain this figure by dividing the total number of clicks for all social media posts over a specific period (such as a month) by the number of social media posts published over the same period.
You should also analyze the social media conversion rate across multiple channels to determine which one performs the best for your brand.
To determine the social media conversion rate, use the following formula:
“Number of social media sales / Total number of posts”
The results will show you a true picture of the value of social media campaigns across different platforms.
You will be able to tell the revenue made from each campaign, enabling you to take the right measures to improve your eCommerce marketing campaigns.
8. Net Promoter Score
The Net Promoter Score (NPS) is a measure of customers’ satisfaction with your brand, which can help improve the number of referrals.
This eCommerce metric determines how likely it is for your customers to recommend your brand to a friend, on a scale of 1 to 10.
It also seeks to understand the reason customers are happy or unhappy with your business, enabling you to take corrective measures.
You can conduct surveys to measure the NPS using tools like Promoter.io, Customer.guru, and Nicereply. You should then segment the respondents according to their answers for targeted email marketing.
For instance, you can divide the respondents into the following categories:
- Detractors: Customers who score 6 points or lower. These customers are unhappy with your brand and will very likely not purchase again or recommend a friend.
- Passives: These are people who score 7 or 8 points. They are somewhat satisfied with your services and may buy again. They are also likely to refer your offering to someone else.
- Promoters: These are people who score 9 or 10 points. They are satisfied with your services, are repeat customers, and can serve as brand ambassadors.
The NPS scores should guide you on the right path to take to address issues affecting customer experience. Therefore, you should reach out to your detractors and passives to understand more about their concerns with your brand and what you can do to improve.
You should use the opportunity to address their problems and possibly regain their trust.
You should also engage your promoters to appreciate them for their support. You can reward them through discounts or other small benefits to strengthen their loyalty towards your brand.
ALSO READ: Top 8 social media strategies that every E-commerce store needs to implement
Conclusion
eCommerce metrics enable digital marketers to observe and measure performance for decision-making purposes.
Some of the sources of data for measuring the performance of your eCommerce store include Google analytics, product pages, social media, emails, and checkout pages.
You can use metrics with KPIs to get a more objective and specific way to measure performance.
Remember to keep your metrics relevant to your business goals so that if your goal is to optimize email marketing, you should use related metrics like click-through-rate and subscription rate.
In this article, we have compiled for you the top 8 eCommerce metrics you should measure, including sales conversion rate, customer lifetime value, average order value, cost per acquisition, cart abandonment rate, and email and social media conversion rates.
You should also measure the net promoter score to assess customer satisfaction and loyalty.
Acowebs are developers of Woocommerce dynamic pricing that will help you add bulk discounts to products on your stores. It also developed the plugin for adding various extra product fields which is called Woocommerce custom fields, that are lightweight and fast. You can easily update your store with these add-ons and enjoy a hassle-free experience, check out the best options for additional Woocommerce custom product addons.