


 Login
Login
 Cart
Cart
The motivation behind the use of heatmaps in eCommerce is derived from the need to improve on sales and keep up with the competition and current trends, especially when it comes to website performance.
Unlike Google Analytics which enables you to monitor web visitor activity, including which pages they visited and where they exited, heatmaps provide advanced insights about the human response.
The tool comes with capabilities that tell you what could be blocking customers from making or completing purchases, giving you an idea of what you should change or amend to ensure a seamless customer journey.
Indeed, heatmaps are highly effective in optimizing conversions because they help you understand the behavior of web visitors, what they are doing on your website, providing you with useful insights on how to improve engagement and trust.
To gain a better understanding of heatmaps, this article will cover the definition of the term and what you can do to effectively use the tool for your eCommerce store.
What are heatmaps?
A heatmap is a graphical representation of data variations in the form of colors, i.e. different color intensity levels and hues.
The term was coined in the early 1990s by Cormac Kinney, a software designer. At the time, the tool was used to aid traders in interpreting financial market data because they could easily visualize buying and selling opportunities.
Today, eCommerce marketers use heatmaps for visual data summaries. Website heatmaps gather and process data and patterns about user activity and interactions, after which the output is displayed in a color-coded format.
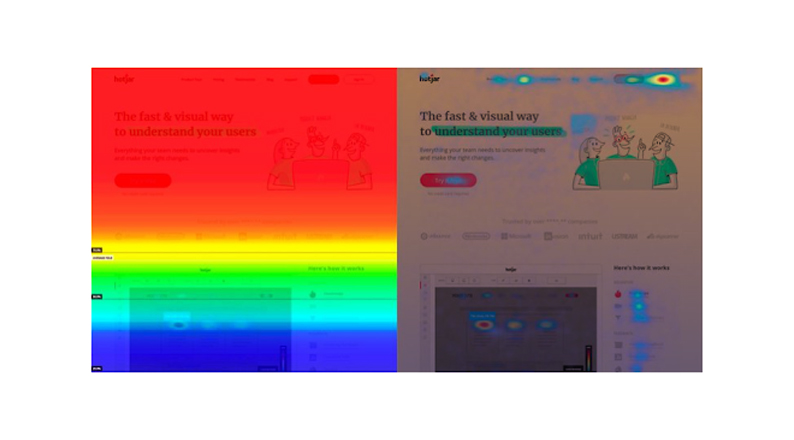
The intensity of interactions is shown using “hotter” and “colder” elements on the website or page visited.
The most popular (hot) and unpopular (cold) sections of the webpage are shown using colors on a scale ranging from red to blue. Using these insights you can understand what users are experiencing as they navigate your website.
Which user activity can you observe using heatmaps?
- Where site visitors have clicked or where the finger has touched (for touchscreen devices)
- Where the mouse has hovered
- Where far down the web page they have scrolled
The highest attention is observed through intense colors – for instance, if your product page has 2 CTA buttons and one is clicked 5 times while the other is clicked once, the more intense color will be observed on the button with the most clicks.
Depending on the analytics sought, heatmaps are categorized into click maps, hover maps, and scroll maps. For instance, colors in scroll heatmaps show the percentage number of users that navigate up to certain levels of the page.
The insights obtained from using heatmaps will tell you which parts of your eCommerce store are attracting the highest attention and which ones are being ignored.
This information is useful in determining how you will position and color your CTA buttons or improve page navigation for increased conversions.
Now that you have an idea of what heatmaps are, let’s have a look at the best practice in using this tool.
ALSO READ: Ways to reduce your eCommerce operating costs
How to effectively use heatmaps for your eCommerce store
Identify website hotspots
Heatmaps enable you to see the areas that web visitors interact with the most. These hotspots will show you how customers read content on your page (e.g. from left to the right-hand-side), or how mobile users scroll down the web page.
If customers are more focused on CTA buttons placed on the right-hand side of your web page, you can adjust the positioning accordingly, for improved conversions.
It is essential to identify the areas customers focus their attention on your website and which ones are not doing well. This observation will equip you with ideas of how to optimize your eCommerce store.
Ensure to A/B test the changes made to your website. For instance, if you notice that some elements of your product descriptions, prices, or specifications are not motivating shoppers to buy your products, you can modify and optimize them to catch the viewer’s eye.
Besides the CTAs and design and layout, other most common website hotspots to optimize following insights from heatmaps include the navigation bar, contact forms, and types of social proof.
Keep in mind how your site is navigated
You can also use heatmaps for eCommerce by tracking how users scroll through your web pages and click on the items and products listed.
The most popular spots on your website can be identified by looking at the mouse pauses and clicks, while highly ignored areas are identified by the less intense coloring.
Desktop users mostly navigate the page from left to right while phone users scroll downwards.
You should analyze the motivation behind the most popular and unpopular areas of your website.
For instance, when people first visit your page, they first see the ‘above the fold’ section before scrolling down.
How far down the page a visitor will go depends on how well your page is optimized. People will not scroll down the page until they are captivated by something they were looking for.
If you notice your CTA buttons are not getting enough clicks, it could mean that site visitors are not scrolling far enough to reach them.
Repositioning the buttons or even changing the color to contrast the page appearance can help in increasing clicks and conversions.
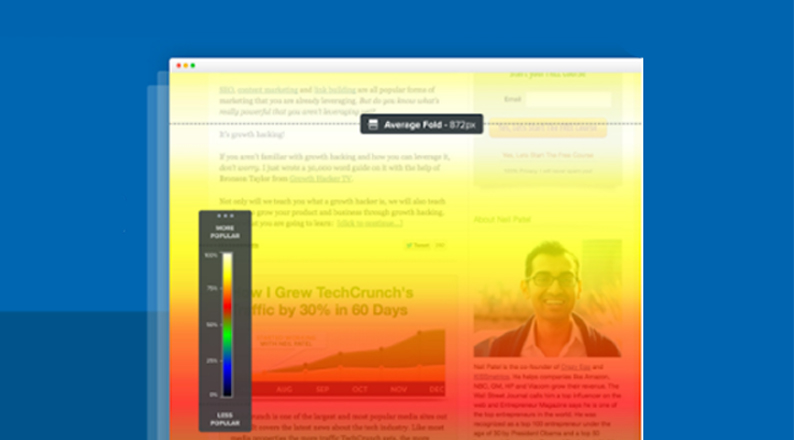
From the scroll map below, you can tell up to what level your site visitors are scrolling on the web page before bouncing.
If the majority of the visitors are only scrolling halfway through, you need to change some aspects of your page design and content to for improved interest.
For click maps, areas with little clicks will have small green and blue patches while those highly visited will be seen in a large red blotch.
Depending on how your site is navigated, you can determine the sections to place your CTAs to attract more attention, both on the desktop and mobile.
If you notice increased activity around sections with links that redirect customers to an external site, you can choose to remove the links or replace them with other pages on your blog.
The idea is to keep the web visitor on the page for longer, and as they navigate up and down and sideways, they are highly likely to stop at the most convenient position – where your CTAs are located.
Evaluate the effect of design changes on user behavior
Heatmaps will tell you when site visitors like the appearance of your page, and the location or color of your CTAs and social media buttons.
Whenever you make changes to these aspects, heatmaps will show you how visitors are responding, e.g. if the number of clicks or hover is different, new areas of focus, and overall improvement in site navigation.
Depending on the response, you can determine if there are more changes to be made to your site design and layout.
Remember the goal is to improve on engagement, clicks, and conversions, thus, changes that cause a negative effect (reduced attention to important areas) should be addressed.
For instance, you might discover that the positioning of the CTAs is accompanied by high visitor count but few clicks and sales.
In such a case, you should review the changes further and use heatmaps to make observations on new user behavior.
ALSO READ: A complete guide to BOPIS (buy online pick up in-store)
Identify overlooked areas
There are those sections of your website that are often ignored by visitors, getting almost zero attention. For instance, it is easy for customers to overlook infographics or certain images because they perceive them as irrelevant.
Heatmaps will tell you exactly which spots are skipped by web visitors, giving you an idea of where and how to make changes.
Placing an advert in such areas is counterproductive unless you have visibility of how customers are behaving.
Click maps, scroll maps, and hover maps will show you the ignored areas and their performance after making the necessary changes.
For instance, you can look at the percentage of shoppers that scroll up to certain sections of the landing page.
If you find sharp color changes, this is an indication that the majority of the people stopped scrolling after reaching a certain point.
You can use this information to determine better areas to position your ads, CTAs, links, and social media buttons.
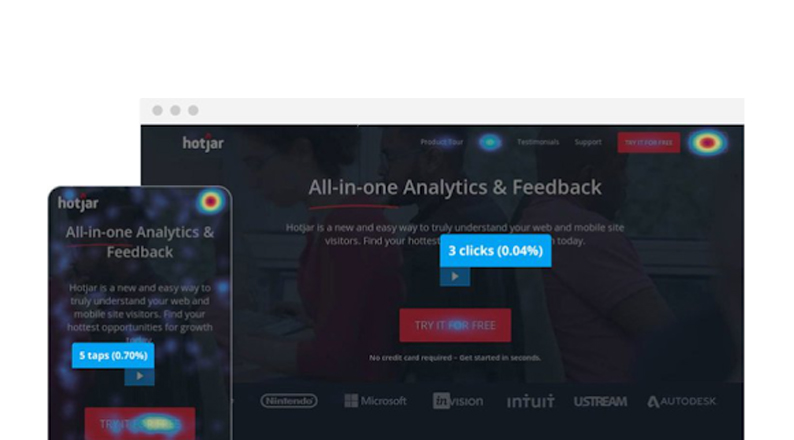
The below click map example is a demonstration of how users ignore a video on Hotjar’s homepage, creating only 3 clicks (0.04%) on the desktop and 5 taps (0.70%) on mobile.
From the image, you can tell that users are clicking on the right side of the desktop and the left side of the mobile, leaving out the video’s CTA button in the middle of the page and above the fold.
Remember non-clickable elements on your page also create confusion among visitors and identifying them through click maps is highly beneficial to your eCommerce store.
Perform data analysis
Heatmap data will tell you several things, including:
- The types of headlines drawing visitors in and causing them to click.
- The images that attract customers’ attention, their features and how the visitors interact with them.
- Distracting aspects on the page that affect navigation.
- Visitors’ ability to see and interact with the opt-in box – perhaps they are not visible enough or they do not stand out.
- If visitors can see the search buttons easily.
- How much content visitors are reading (as seen through scroll maps).
Even with this information, you must appreciate that heatmaps don’t work on their own. Instead, you should analyze the results to understand consumer behavior.
For instance, you may discover that a given percentage of customers are not scrolling down to read the entire content on your page, but you may not know the reason.
You could also notice that visitors are ignoring certain links or CTAs, but having a better understanding of how consumers generally scroll a site could tell you why the clicks and conversions are lower than expected.
Highly popular areas can be seen from the pressure points, and such spots are certainly great places for positioning your CTAs and ads.
When you effectively use heatmaps for your eCommerce store, you will get to know if users can easily find the buttons or options they need to click, the types of images liked by most visitors (color, size, shape), areas users mostly linger on, and the type of text they prefer to read before making a purchase decision.
With analytics, you will have a better grasp of your users’ interaction with the content, which is different from the expectations of the site designers, developers, and owners.
Heatmaps will tell you what customers want to see or how they prefer interacting with your eCommerce store, and responding to these signals will ultimately cause an increase in your sales conversions.
ALSO READ: Tips to use content marketing for eCommerce sales
Heatmap analysis tools
When selecting heatmap analysis tools, you have to consider the type of analytics you need, such as ecommerce A/B testing, session recordings, and other features.
Here are the top 7 tools you can use to track your eCommerce store’s user activity and behavior:
Hotjar
Hotjar is one of the leading heatmap analysis tools, with more than 900,000 corporate users. You can use it to watch session recordings, perform A/B tests, conduct user surveys, and observe how people interact with your products and services.
Product designers can also see the user behavior and twick your page to suit visitors’ needs and priorities.
The analytics tool helps you link between quantitative and qualitative data, creating insights that help you determine the most needed and high-impact changes for your eCommerce store.
Hotjar can be integrated with your eCommerce platforms like Shopify, Magento, WooCommerce, and Wix.
Crazy Egg
Crazy Egg is a heatmap analysis tool that helps you optimize your eCommerce store for purchases through output like snapshots, session recordings, and heatmaps.
With the Crazy Egg Editor, you can easily make changes to your analysis parameters, and you can also integrate the tool with eCommerce platforms like WordPress, Shopify, and Magento.
Inspectlet
Inspectlet comes with heatmaps for visual recording of store visitors’ mouse movements, scroll maps, and session recordings.
The session recording will show you how users move their mouse, press keys, scroll, etc. The filter function helps you set the kind of data you want to analyze, while the conversion funnel tells you at what point shoppers drop off.
Inspectlet also has A/B testing capabilities and a tagging API that links metadata to the user session.
ALSO READ: How to use psychology to shape your E-commerce success
SessionCam
In addition to features like heatmaps, session replays, and conversion funnels, SessionCam is also integratable with Google Analytics.
Additionally, you can easily compare different heatmaps side-by-side, e.g. desktop and mobile sessions.
Contentsquare
Besides heat mapping capabilities, Clicktale (now known as Contentsquare) is used by leading eCommerce brands like Walmart, Avon, Clarks, and TMobile.
The tool comes with a playback feature, enabling you to replay individual user sessions.
Other features include A/B tests, video tracking, webform analytics, and a comprehensive customer journey analytics. You can also integrate the tool with your eCommerce store.
Smartlook
Smartlook gives you a better understanding of how users navigate your site. The tool has analytical capabilities for both mobile and website, providing you with insights on why users are ignoring some elements, abandoning orders, or leaving the page.
You can use the knowledge gathered to improve your eCommerce store’s website design and marketing strategy.
Lucky Orange
Lucky Orange offers real-time analysis of user sessions, clicks, and form submissions.
In addition to tracking mouse moves and scroll depth, you can use the tool to filter multiple metrics, such as browsers, dates, devices used, etc.
You can also replay the sessions and evaluate them using comprehensive analytics.
The chat feature is equally useful in communicating with your eCommerce store visitors at various sections, such as the checkout and conversion funnels.
You will also have the added advantage of collecting user opinions using polls.
ALSO READ: Top 8 Social Media Strategies That Every E-commerce Store Needs To Implement
Conclusion
Heatmaps like click maps, scroll maps and hover maps are must-have tools for monitoring user behavior on your eCommerce store.
To effectively use them, start by identifying website hotspots and how the site is navigated.
You should then review the impact of changes on the portal, identify overlooked/ignored areas, and finalize with performing data analysis.
There are many heat-mapping tools you can choose from but ensure to go for one that has a full collection of essential features like A//B tests, session recordings and replays, surveys, side-by-side comparisons, and comprehensive analytics.
Acowebs are developers of Woocommerce bulk discounts that will help you add bulk discounts to products on your stores. It also has developed various other plugins like the popular plugin for managing the checkout form fields in WooCommerce, called Woocommerce Checkout Manager, which is highly feature-oriented yet lightweight and fast. There is also a free version of this plugin available in the WordPress directory named WooCommerce Checkout Field Editor.