The golden rule of eCommerce marketing is “measure your results.”
It is easier to improve your sales efforts or even come up with new marketing channels after measuring your result. The most common free analytics tool is Google Analytics.
For most users, the tool comes integrated into your eCommerce and all you have to do is learn how to interpret the data you receive.
While Google Analytics is a free and useful tool, it requires a learning curve thanks to its lack of an intuitive interface. This post shows you how to set up your account and how to track the stats that matter.
Why Use Google Analytics?
Unlike a physical store, you cannot see your customers in an online store. This way, you cannot tell their behavior and shopping needs.
Without an analytics tool, you are blind to information about your visitors and this makes it impossible for you to improve your business.

Google Analytics helps you understand how effective your marketing efforts are so you can optimize your store to convert better. Unlike most other analytics tools, this one is free.
ALSO READ: How To Customize WooCommerce Checkout Page – A Handy Guide
Setting Up Google Analytics
Setting up Google Analytics requires a Google Account. If you have a Gmail account, you can use it to create an account on Google Analytics.
Open Google Analytics and sign in to start using the services. Next, add Google Analytics to your store and start tracking your website traffic details.
Different platforms have different ways of integrating Google Analytics. You can call customer support or read the provided resources to see how your platform works.
Some solutions have a built-in solution that only requires you to add your tracking code to start the analytics.
These platforms include Squarespace, Shopify, Weebly, BigCommerce, Gumroad, Storenvy, and Ecwid. Others require that you use a plugin. These are Big Cartel and WooCommerce. You can click on each of the sites above to see how to set up Google Analytics.
Once you set up, you will see a blank analytics page since Google Analytics can only track data once it is installed.
Setting Up Google Analytics for Ecommerce
Once you have an account linked to your eCommerce site, you need to perform a few tweaks to ensure that you track only information relevant to your eCommerce site.
Such states include the number of products bought, the most popular products, which products were most viewed, and such other stats.
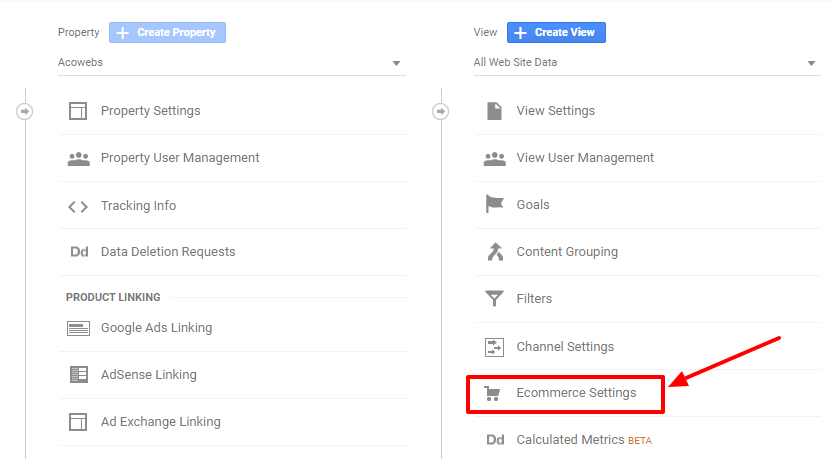
To set that up, open the settings of your Google Analytics by clicking Admin >> View Settings. From there, choose Ecommerce Settings, and a page that prompts you to enable eCommerce will pop up.
“Enable Ecommerce” by clicking the toggle button and click “Next”. From the next page, click “Submit” and your account will be ready to track all your eCommerce metrics.
From the Enable Ecommerce page, you will see an Enhanced eCommerce option. If you click this, it takes you to a page where you can define your checkout funnel to see more reports.
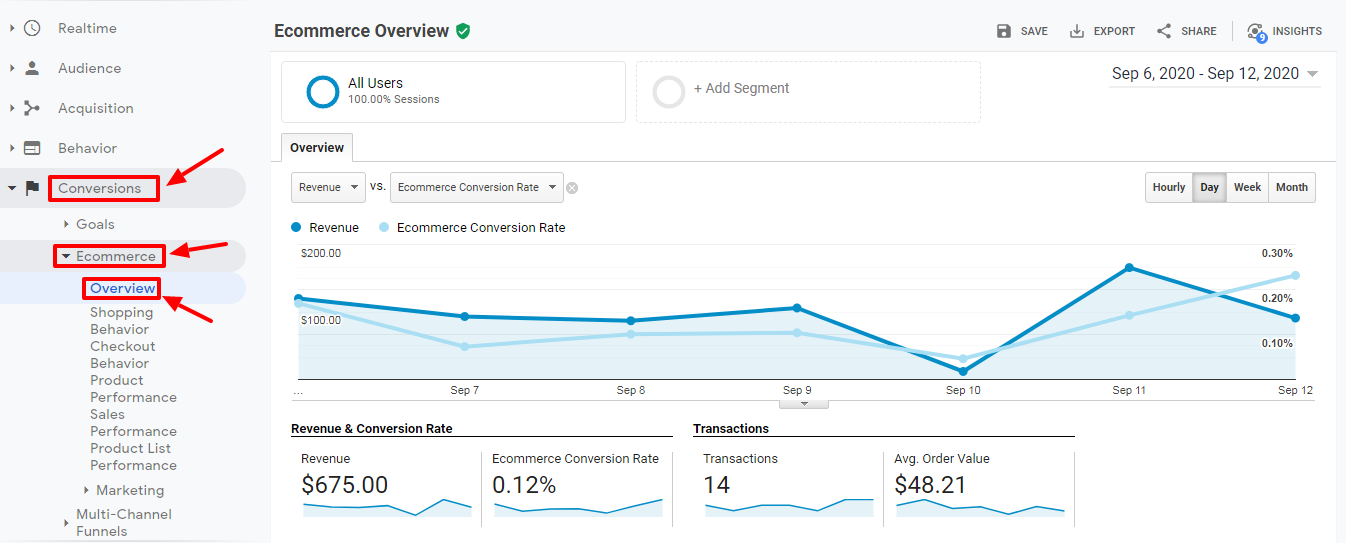
You can see an overview of your eCommerce data by opening Conversions >> Ecommerce >> Overview. You can see in-depth data on your customer behavior and the general performance of your store.
ALSO READ: How You Can Use IoT To Leverage Your Ecommerce Business And Multiply Your Profits
Statistics That Matter
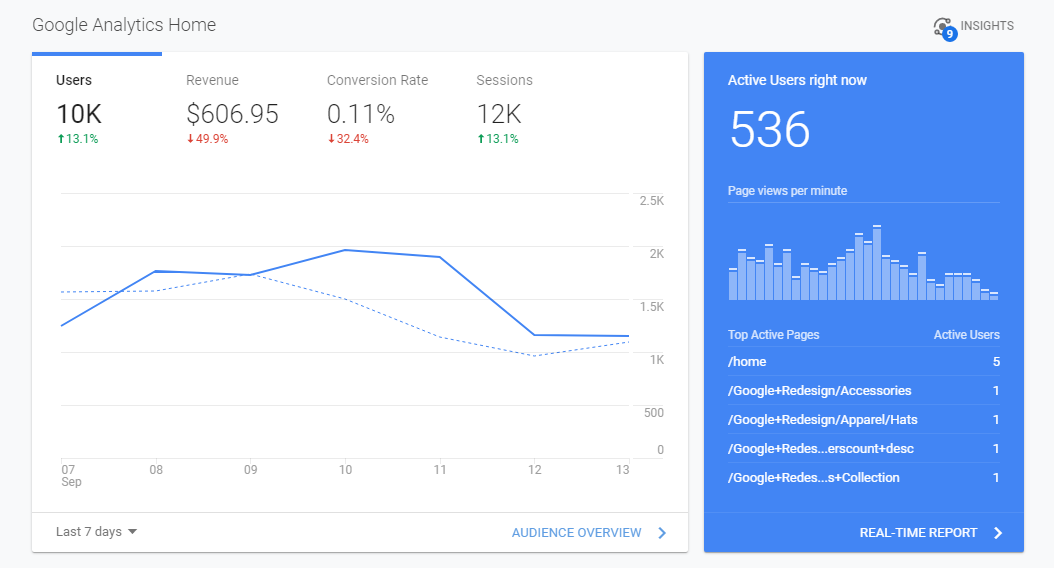
When you open Google Analytics from your store, you will see an overview of your basic audience. The information includes a graph showing the number of users over a few days.
You will also see the number of sessions, number of visitors, page views, pages per session, duration of each session, and bounce rate.
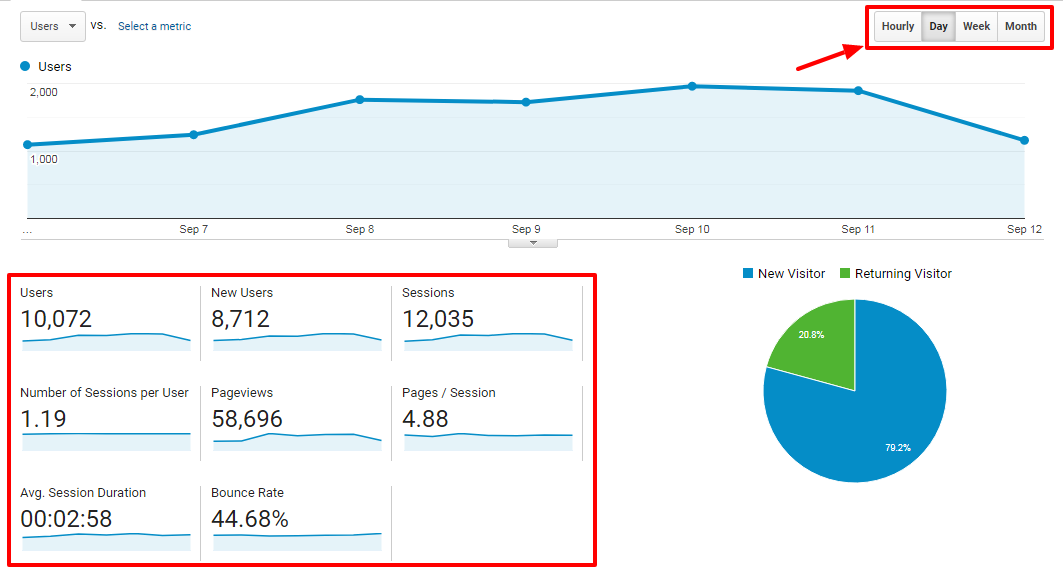
The graph shows the performance of your site with a given range. Google interprets a session as each time a customer browses through your store. You can change the data range to make it a few weeks or a few months. You can also “compare to” to see the performance of your store in different periods.
You can also see information on the behavior of your customers including:
- Number of unique visitors
- Number of pages they visited
- The time they spent on your site
- How quickly they left the site (bounce rate)
You will also know where your visitors come from and who they are. Here, you can see how many new visitors you have and how many are returning visitors.
Although the information you get is a general overview of your store, interpreting the data right will help you propel your store to the next level.
ALSO READ: Best UX Practices For An Ecommerce Checkout
How To Use The Stats From Google Analytics
Understand Visitor Channels
You need visitors for your store to succeed. Without visitors, your store will not have any purchases. If you are able to convert your visitors to buying customers, your sales will improve.
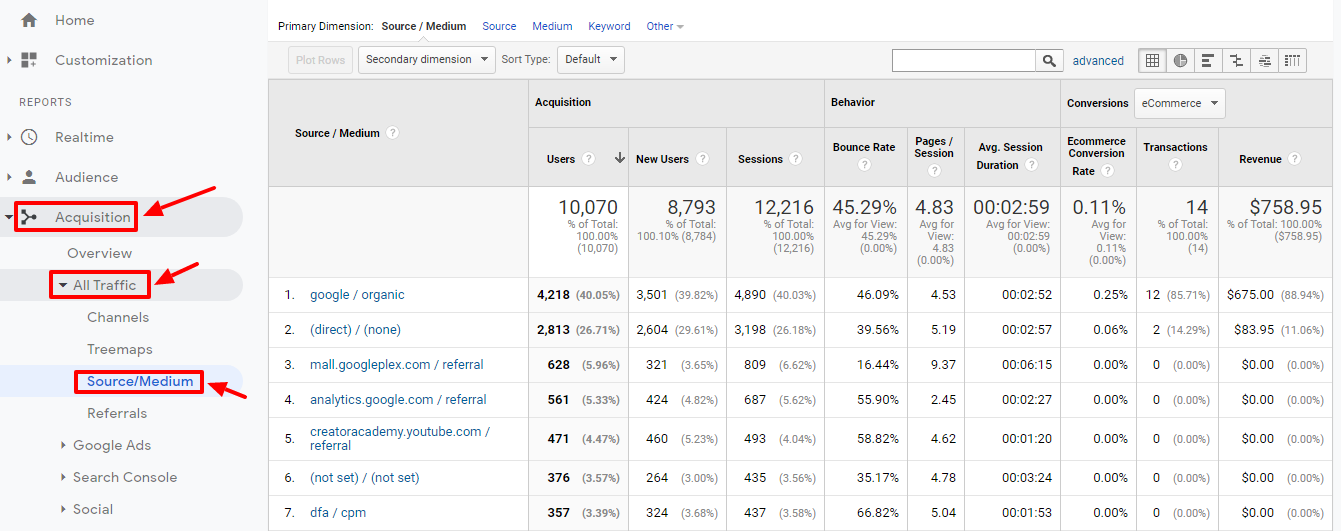
For starters, you can see visitor acquisition stats by opening Acquisition >> All Traffic >> Source/Medium. You will see an overview of where your visitors come from.
There are different channels starting with direct visitors. Direct visitors either type your store’s URL in their browsers or they use a channel that Google Analytics does not recognize.
These direct channels might include links in word documents or PDFs, a link in Skype, links from bookmarks, and from desktop software among others.
Google/Organic visitors are those who get to your site through a search engine.
ALSO READ: 7 Ways To Prepare Your Online Store For Holiday Sales
There are also visitors from referrals, which means visitors from any other site other than a search engine. These other sites include social media sites such as Facebook and Pinterest or blogs.
With the channel stats, you can see which channels bring in visitors so you can concentrate your efforts on these channels.
If there are channels stalling, you can find a way to make them active again. You might also see traffic from unexpected sources such as blogs that publish a link to your store.
ALSO READ: WooCommerce SEO: The Ultimate Guide To Follow In 2020
Bounce Rate Stats
Bounce rate shows you how long people want to stay on your website. This can help you uncover major flaws in your marketing efforts. Bounce rate shows how quickly people leave your website – it is a number you need to keep as low as zero.
Basically, it is the number of visitors who leave your website after visiting one page.
If your bounce rate is high (anything more than 50 percent), then your website might have a problem. One of the issues might be a slow-loading page.
Most of the users are not willing to wait for a page that loads for longer than 3 seconds.
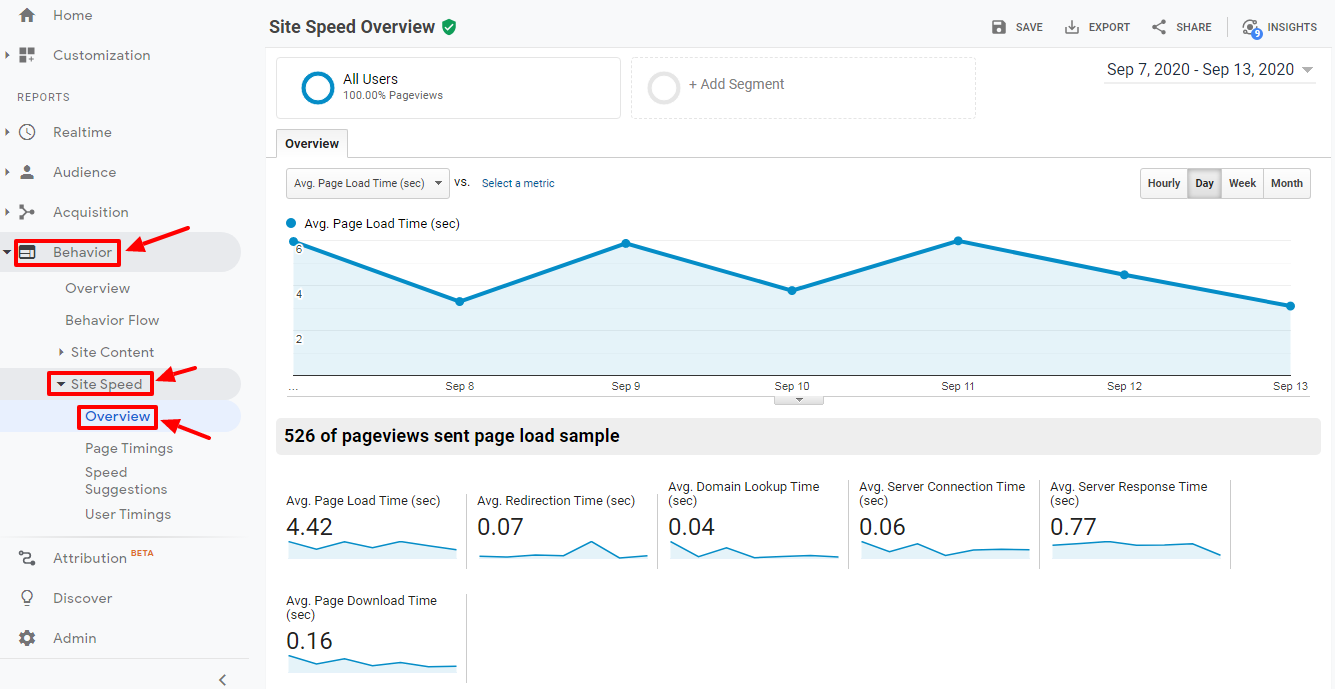
You can see how fast your pages load by opening your Google Analytics Speed overview. Open Behavior >> Site Speed >> Overview. You can see the average load times of pages on your website and also the performance of specific product pages.
If your pages take longer than 3 seconds to load, check your image sizes as they may be too big to open fast. If your images are big, compress them and then re-upload them.
Another reason for a high bounce rate is visitor expectations. If your visitors are expecting something else, they will leave as soon as they arrive. Set visitor expectations during your marketing campaigns.
ALSO READ: 12 General Mistakes That WooCommerce Shop Owners Make And How To Avoid Them
Location Stats
You can see where your visitors come from by opening Audience >> Geo >> Location from your Google Analytics account. Understanding the location of your visitors helps you optimize your marketing efforts.
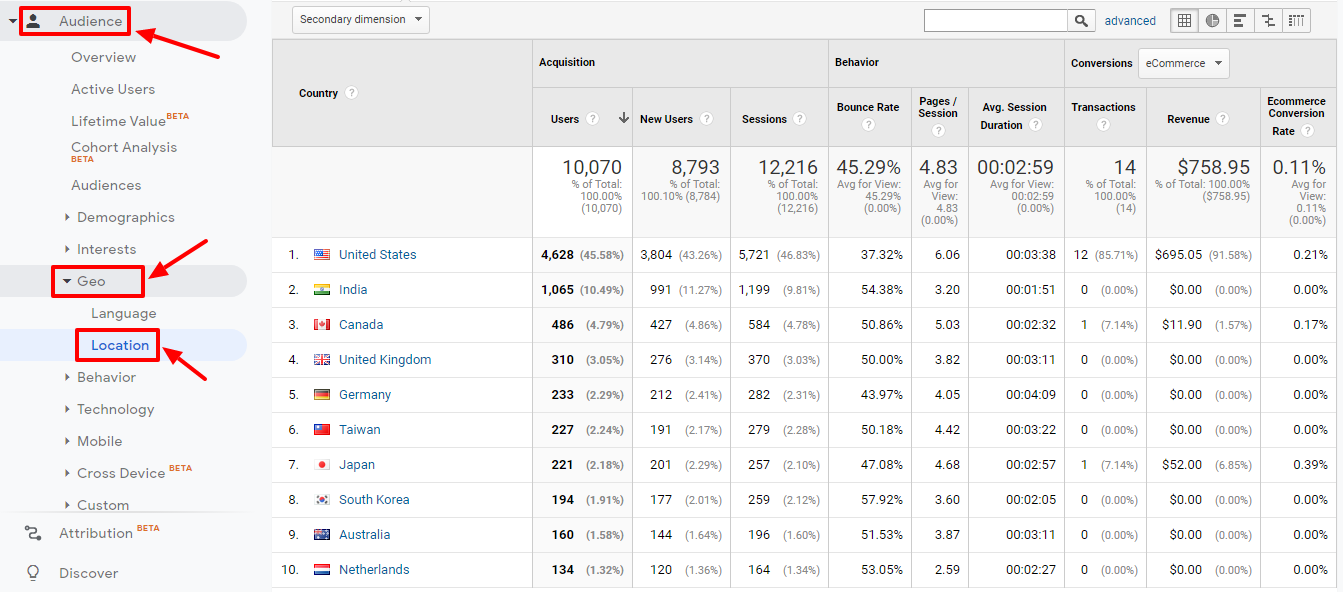
If, for instance, most of your customers come from a specific country, you can use that information to market to them.
Some of the changes you can carry out include adding targeted Facebook ads or telling customers that you ship to their location. You can also offer reduced shipping rates for customers in those regions or countries.
ALSO READ: How WooCommerce Online Business Growth Can Be made Faster?
Track Your Sales
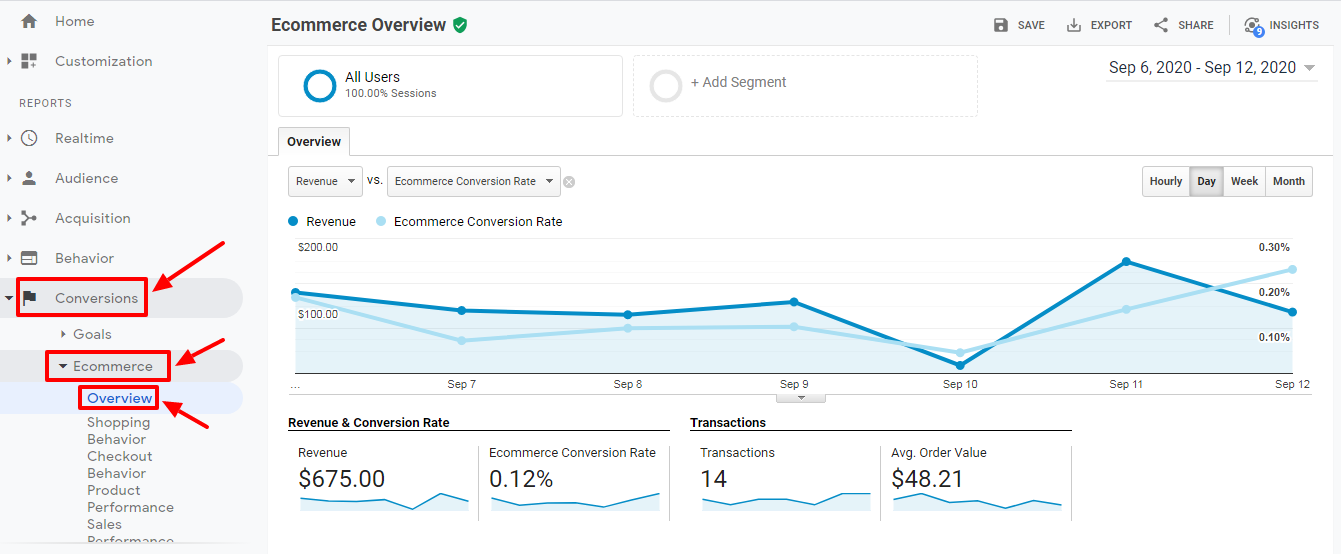
By activating the Ecommerce section on Google Analytics, you can view your customers’ stats in depth.
To see your stats, visit Conversions >> Ecommerce >> Overview and you will see a graph. From the graph, you will see how much you have earned over a defined period.
ALSO READ: An Ultimate Guide To WooCommerce Dropshipping
Track Product Performance
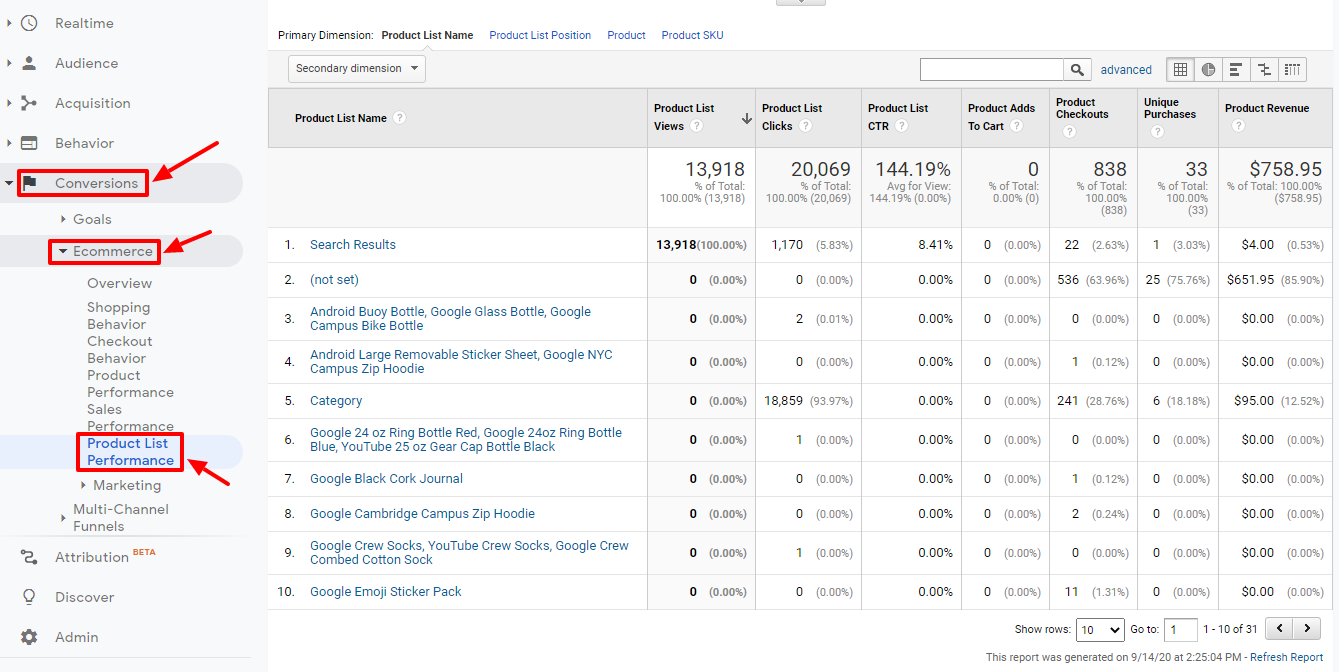
From the product performance tab, you can see the performance of individual products. The tab shows you the most purchased items. With those stats, you can work to increase the sales of other products or how to maximize the sale of your popular products.
If you notice that people are mostly buying hats, you can add more hat designs to attract even more buyers, start a hat sale, or use a mug as the product image in your advertising campaigns.
Conclusion – Identify Errors And Rectify
The data you get from Google Analytics should inform your future marketing decisions. It helps you choose the advertising channel that works best and one that you should drop from your list of go-to channels.
Once you activate Ecommerce on Google Analytics, you will see the monetary returns from your store.
You can extend your Google Analytics tracking to see what your customers search for online. Login in to your Google Analytics, open settings and turn onsite search tracking.
This gives you a sneak peek into the minds of your customers so you can understand their needs better. If your customers are searching for mugs more, you need to make mugs more available.
In conclusion, Google Analytics shows you statistics that are supposed to give you an insight into your customer behavior.
Acowebs are developers of WooCommerce plugins that will help you personalize your stores. It supports the additional option with feature-rich add-ons which is WooCommerce Product Addons, that are lightweight and fast. Update your store with these add-ons and enjoy a hassle-free experience.


 Login
Login
 Cart
Cart